Homeless Youth Initiative
Goal: Convert data into info graphics
To truly integrate and act on something I need to understand the full context, the how, and why. Pride Action Think Tank was my first chance to do that as I sat in on early planning meetings about their visions for the organization, including for one of their first initiatives on addressing youth homelessness, which affects gay youth at twice the rate of the overall population.
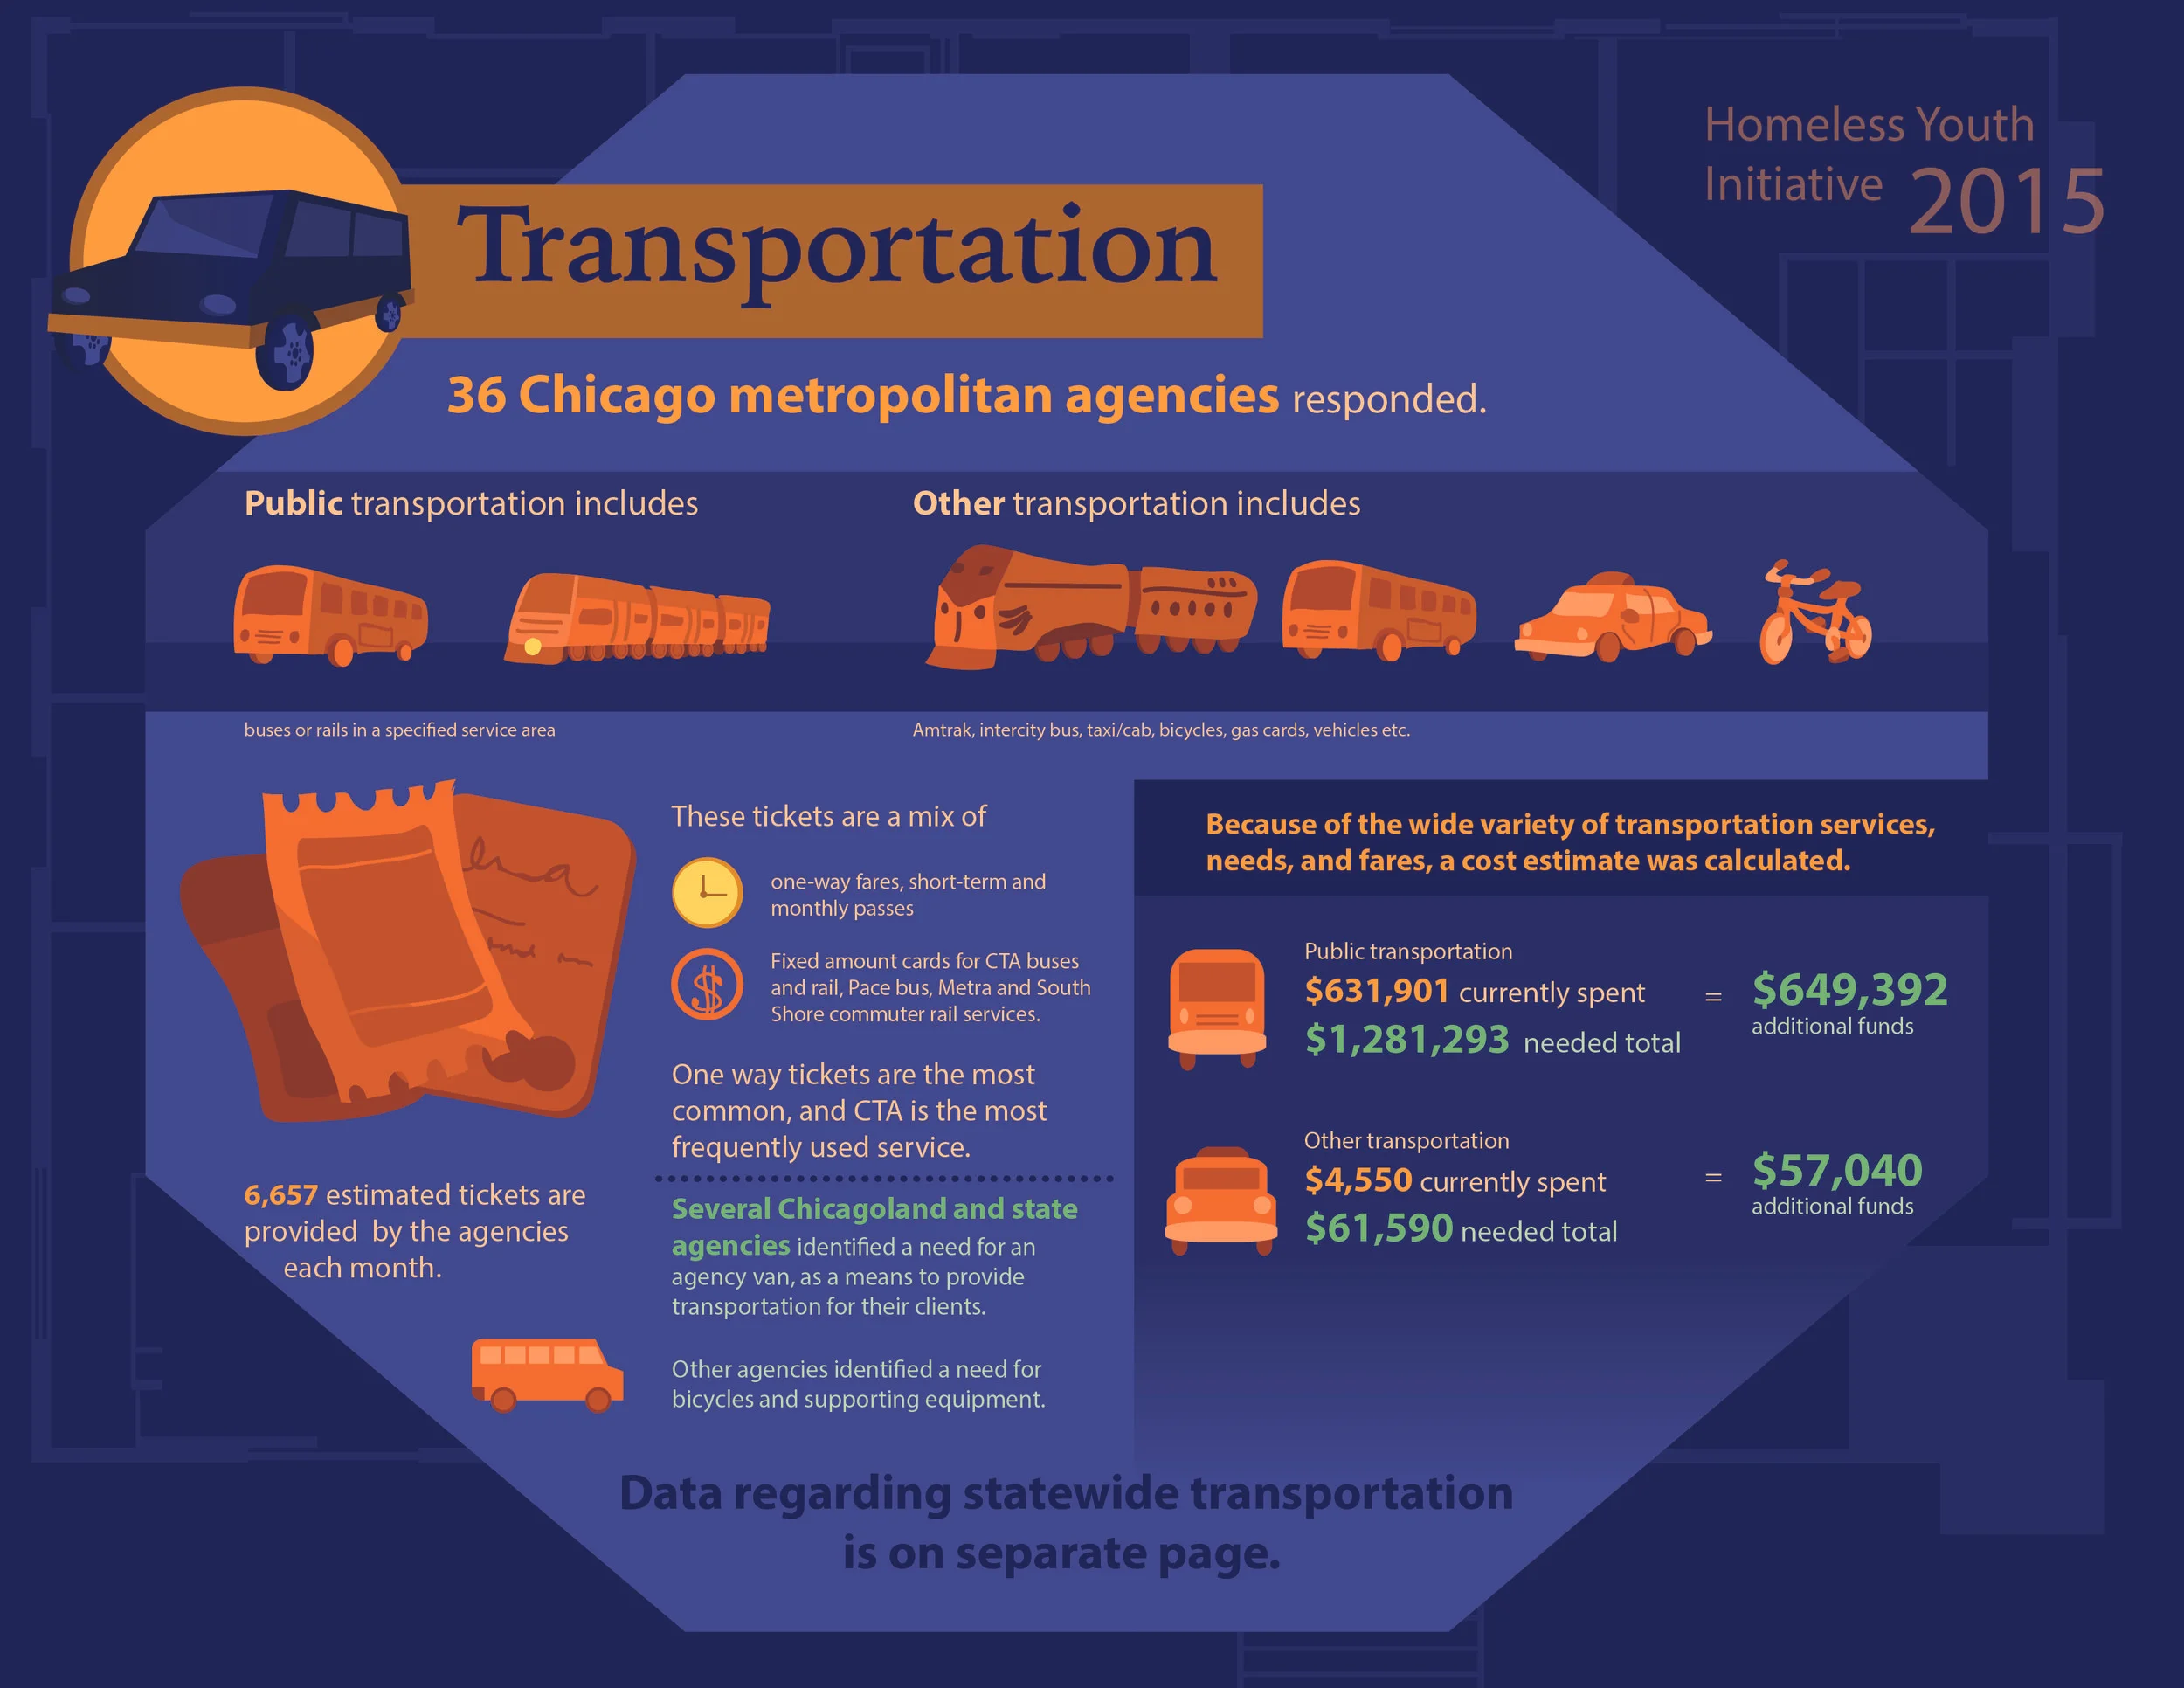
To help their fundraising, I was tasked with converting PowerPoint and spreadsheet stats on preexisting homeless agencies into fifteen info graphics. I had to analyze and categorize this data, ranging from transportation to makeup services, decide what to include and emphasize (with my boss’ approval), and manage both large and minimal amounts of copy to create unique but complementary info graphics. In other words, I couldn’t just throw typographic hierarchy onto copy and pasted information—I had to actually understand it.